OntoViz
OntoViz
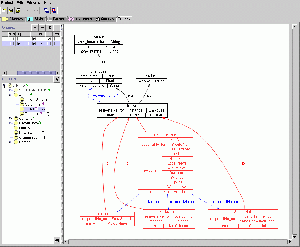
The OntoViz Tab allows you to visualize Protege ontologies with AT&T's highly sophisticated Graphviz visualization software.
Contents
Versions & Compatibility
This section lists available versions of OntoViz.
| Version | Compatible with | Dependencies |
|---|---|---|
| OntoViz 1.0 | Protege-Frames 3.4 Protege-OWL 3.4 Protege-Frames 3.3.1 Protege-OWL 3.3.1 Protege-Frames 3.2.1 Protege-OWL 3.2.1 |
If you click on the button below to add a new version of OntoViz, you will be asked to define a page title for the new version. Please adhere to the naming convention of OntoViz X.X.X when you define the new page!
Changelog
| Version | Changes in this version |
|---|---|
| OntoViz 1.0 | no release notes were maintained for this version |
Detailed Description
The OntoViz Tab allows you to visualize Protege ontologies with the help of a highly sophisticated graph visualization software called Graphviz from AT&T. The types of visualizations are highly configurable and include:
- Picking a set of classes or instances to visualize part of an ontology
- Displaying slots and slot edges
- Specifying colors for nodes and edges.
- When picking only a few classes or instances, you can apply various closure operators (e.g., subclasses, superclasses) to visualize their vicinity.
Installation
The OntoViz Tab is bundled with the "full" installation of Protege (please use version 3.3.1 or 3.4).
Once you have installed Protege, you must also:
a). Install the appropriate version of the Graphviz graph visualization software for your platform.
b). Modify your "protege.properties" file to specify where you installed Graphviz. For example, if you installed Graphviz in C:\Program Files\ATT\Graphviz\, you would add the following line to protege.properties:
dot.command=C\:\\Program\ Files\\ATT\Graphviz\\bin\\dot
NOTE: you may need to modify your file structure to match the path in your protege.properties file. Check protege.properties for more details.
The protege.properties file is located in the root directory of your Protege installation and an example protege.properties file is included in the OntoViz subdirectory for your reference
<protege-install-dir>/plugins/dfki.protege.ontoviz/protege.properties
In addition to specifying the path to the Graphviz dot executable, you can set the following optional attributes:
dot.font=<font-name> (optional; usually Arial)

dot.fontsize=<size-specification> (optional; usually -2 or -3)

dot.fontpath=<path-to-ttf-directory> (needed on some flavors of Unix; on Solaris: /usr/openwin/lib/X11/fonts/TrueType)
Mac specific notes on installation
Many thanks go to Andy Spydell for providing the following Macintosh specific instructions for configuring OntoViz and Graphviz. Andy used Mac OS X (10.4):
Download the latest Mac OS X version of Graphviz (current is 1.13 v16). I chose the disk image version (dmg) version. Upon extracting and mounting, you will find two files contained within the disk image: Graphviz (an Application) and an Examples directory.
Create a directory to hold the Graphviz application and Examples directory at a location of your choice (for example, I created a directory called /Users/andy/Developer/Tools/Graphviz). The disk image is named something like "Graphviz 1.13 (v16)", which makes a poor directory name due to the spaces, period, and parentheses.
Copy the Graphviz application and Examples directory into your newly created directory.
In the Finder, locate the file named "protege.properties" in the Protege directory, and open it with TextEdit (right-click, open, other, select TextEdit). You need to add a line to the file that tells Protege where to find the Graphviz UNIX executable. For me, the line of text looks exactly like:
dot.command=/Users/andy/Developer/Tools/Graphviz/Graphviz.app/Contents/MacOS/dot
Save and close TextEdit.
Property = OWLViz.Dot.Path, Value = full path name of location of dot executable
Then it worked for me.If you don't see any graphs after you begin using the OntoViz Tab in Protege, verify that the dot.command value does in fact represent the "dot" UNIX executable. The easiest way to do this is with the Terminal and "ls" command. Copy the dot.command value from the protege.properties file and paste it into a Terminal window:
terminal> ls /Users/andy/Developer/Tools/Graphviz/Graphviz.app/Contents/MacOS/dot
If the file is not found, you will then need to correct the path value in protege.properties.
Documentation
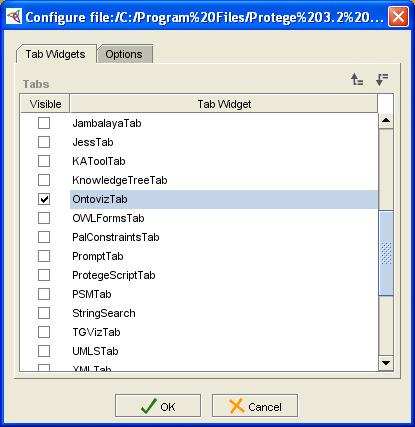
To enable the OntoViz Tab in Protege, choose the menu item Project -> Configure, check the checkbox next to the entry for the OntoViz tab widget, and click OK.
Creating a graph
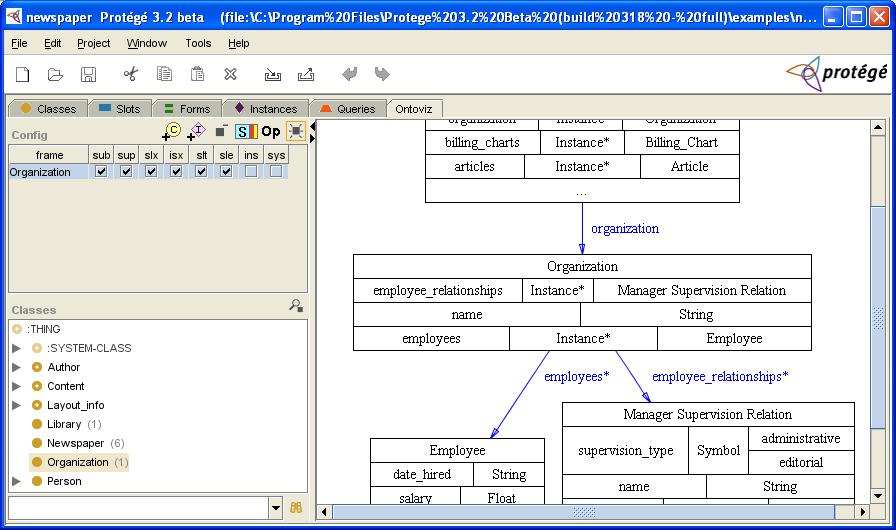
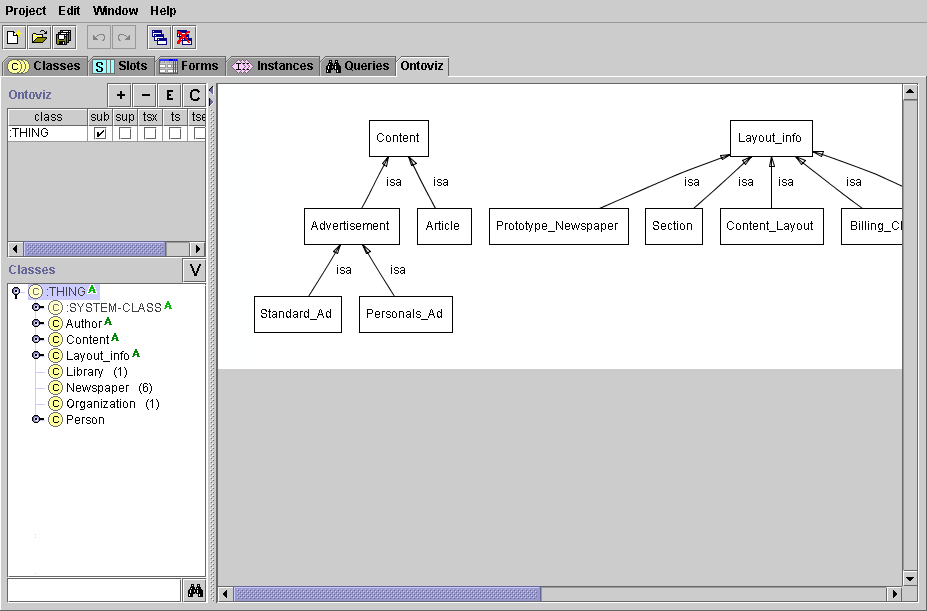
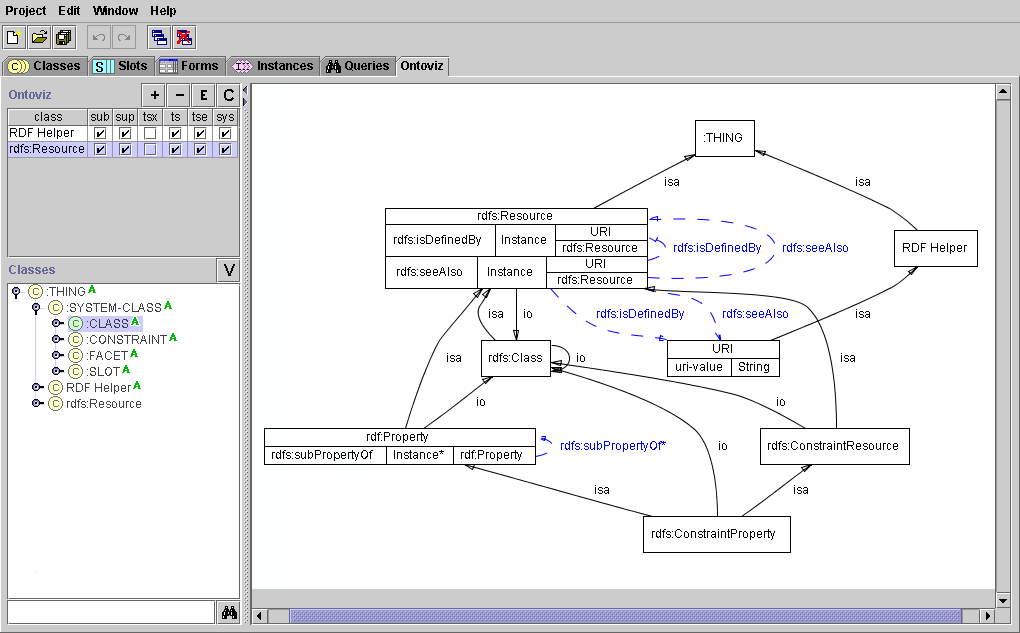
To create a graph, select a class from your ontology in the Classes pane, click the "add class" button in the upper left "Config" area of the tab, check several of the options such as "sub", "sup", "slx", and click the "Create Graph" button. The same process can be used for creating graphs of instances by using the "add instance" instead of the "add class" button. To remove an entry from the Config table, use the "remove class" button.
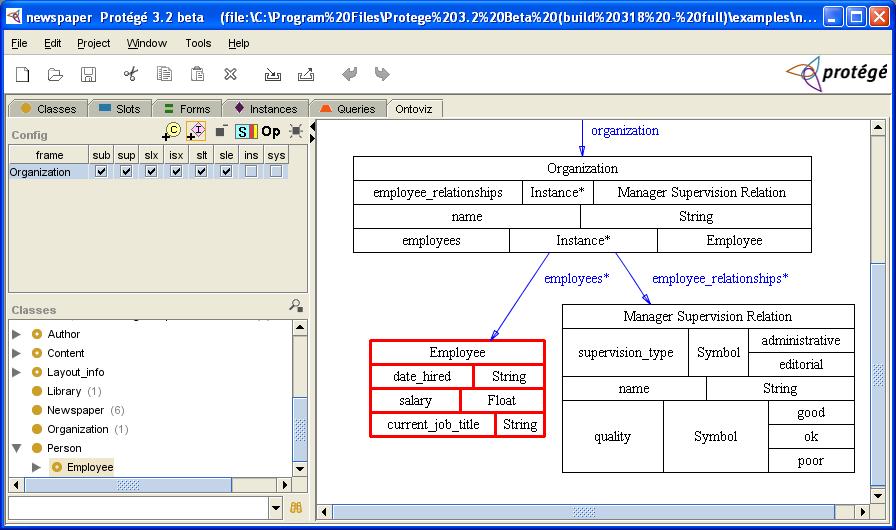
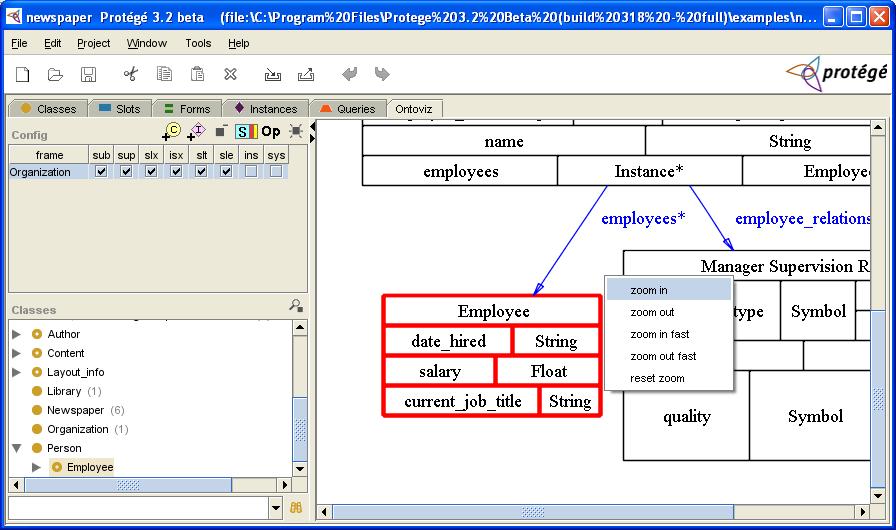
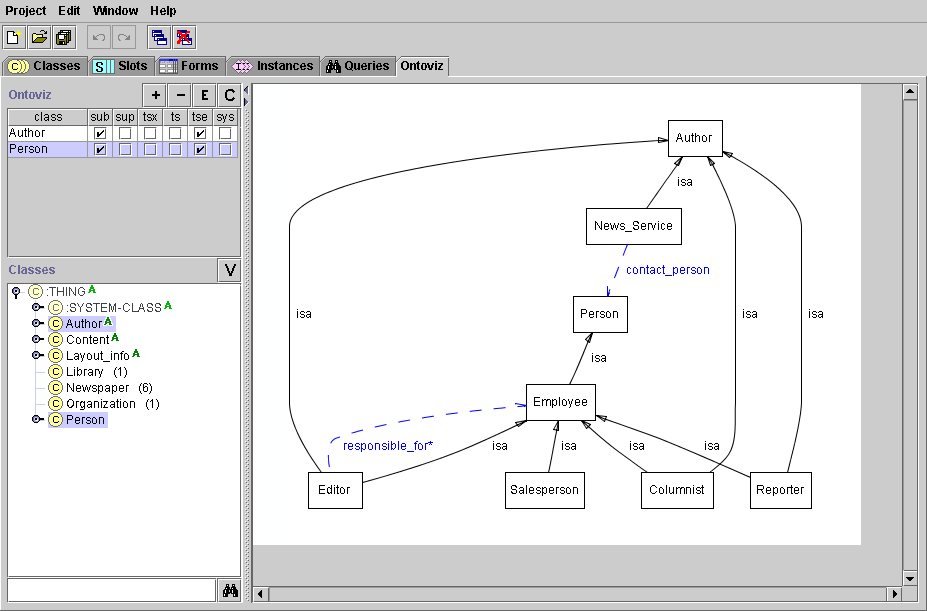
Selecting a node in the graph displays the corresponding class in the classes tree (and vice versa):
You can also use the middle and right mouse buttons for zooming:
Fine tuning your graph
To fine tune your graph, e.g., for showing only a part of your ontology, the following options are available:
1. Options per class/instance, i.e., per row in the Config table.
Check or uncheck any of the following check boxes next to an entry in the Config table:
- sub - subclass closure
- sup - superclass closure
- slx - slot extension
- isx - inverse slot extension
- slt - slots
- sle - slot edges
- ins - instances
- sys - system frames
The (simplified) semantics for each row in the table are as follows:
closure := {frame[row]}
- sub/sup: compute the subclass and superclass closures if frame is a class (independently; otherwise we would always end up with all classes):
closure := closure U subClosure U supClosure - slx/isx: for all classes/instances in closure, find the classes/instances that are reachable by a slot of type INSTANCE or CLASS (the maximum depth can be configured on the global options window; default is 1 for classes and 3 for instances):
closure := closure U slotExtension - ins: add all instances of classes in closure to closure:
closure = closure U instances(closure) - slt/sle/sys: (globally) mark all frames in closure accordingly
If sys is not true, in all steps above ignore system classes and slots.
It is also possible to add a class more than once to the Config table with a different options set. Some examples using the newspaper project might be:
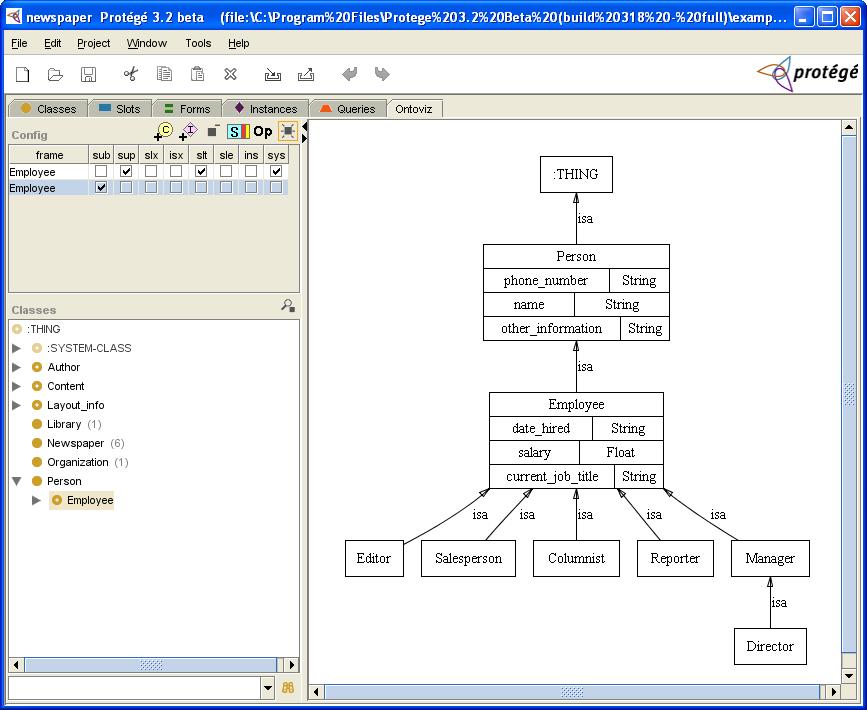
a. Inspect one class in the middle of the ontology, e.g., Employee.
Employee sup slt sys
Employee sub

shows all superclasses of Employee WITH template slots and all subclasses WITHOUT template slots
b. Show a class and its "template slot neighborhood", e.g., Newspaper.
Newspaper sup slx isx sys
2. Options for slots
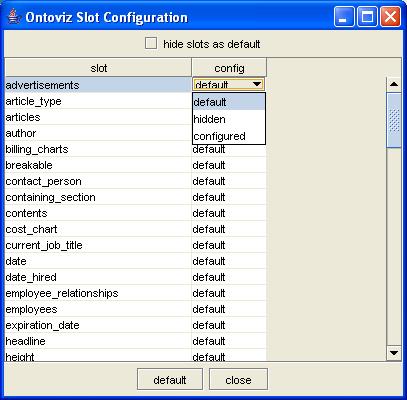
Slots can be configured individually by pressing the colored "S" button. A slot can be configured as "default", "hidden", or "configured" (at the moment, a configured slot means that the user selected color and preferred arrow direction). Furthermore, all "default" slots can be hidden ("hide slots as default" check box). To configure a slot, click on the "default" cell in the table.
3. Global options
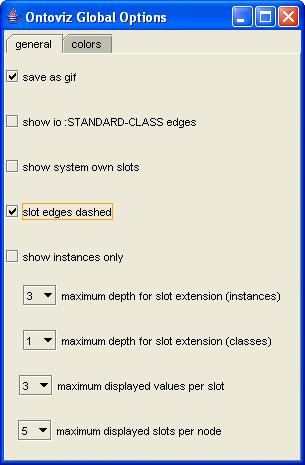
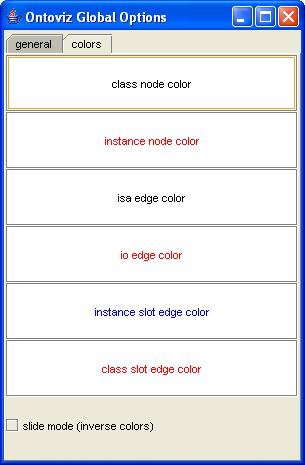
The following global options are available in the "Ontoviz Global Options" dialog by clicking on the "Op" button.
- save as gif - save the graph as a GIF image in the directory where the project resides, or in the main Protege directory, if the project has not yet been saved
- show io :STANDARD-CLASS edges - if this box is checked, instances of ("io") :STANDARD-CLASS links are shown (results in really huge graphs!)
- show system own slots - if this box is checked, system own slots are shown (e.g., :NAME), which are not very useful except for debugging system stuff
- slot edges dashed - use dashed lines for slot edges (useful for printing)
- show instances only - don't show the classes (useful if you want to inspect complex relationships between many instances)
- on the colors tab, you can configure colors for nodes and edges.
Screenshots
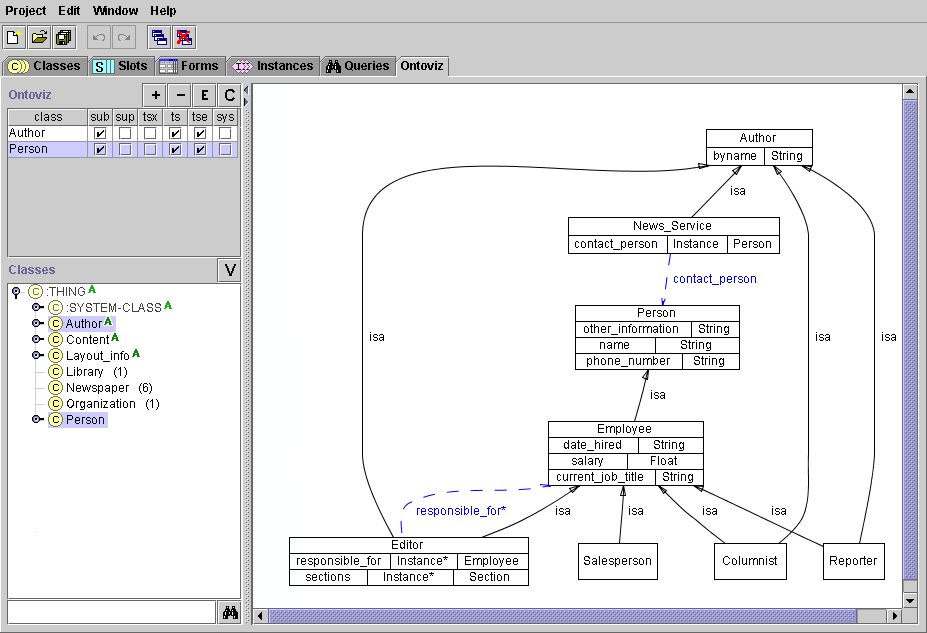
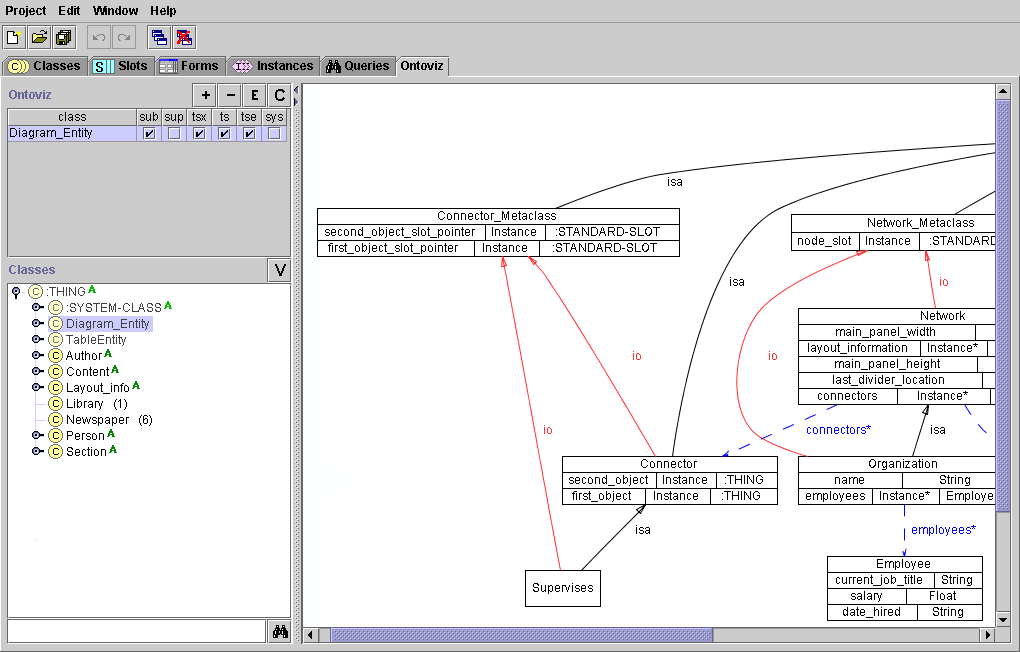
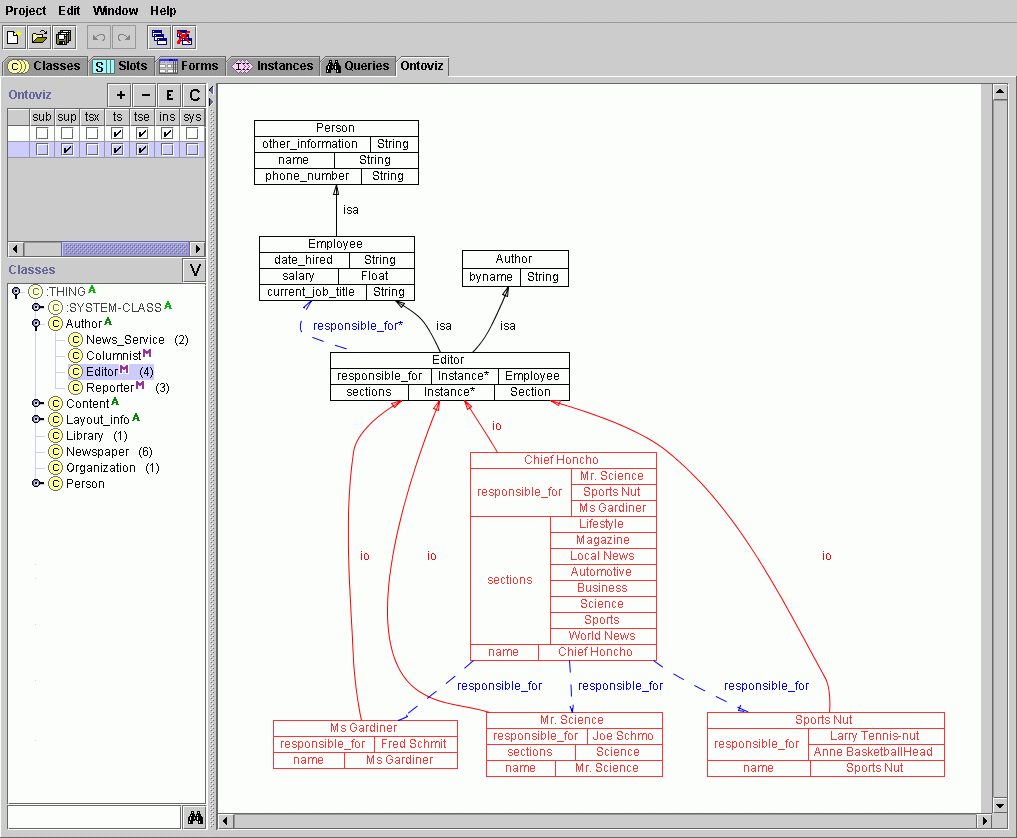
To follow are some additional screenshots of the OntoViz Tab. The graphs were generated using the newspaper example project that comes with all installations of Protege. Please note that these screenshots were created using an older version of Protege.
Level of Support
Unsupported. The source code for this tab is available in the Protege Subversion repository. To view the code, please use this URL:
http://smi-protege.stanford.edu/svn/ontoviz-tab/trunk/
... or, to check out the code, you may use this URL:
http://smi-protege.stanford.edu/repos/protege/ontoviz-tab/trunk/
If you have questions about OntoViz, you can try posting them on the protege-discussion mailing list and someone from the Protege community may be able to help you.
