Difference between revisions of "ChangeAnalysisTab"
(→Installation) |
|||
| Line 32: | Line 32: | ||
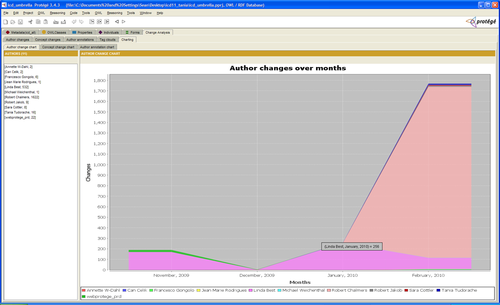
= Chart View of Author Changes = | = Chart View of Author Changes = | ||
[[Image:Author_change_chart.png|500px| Displays all edits authors have made throughout the life time of the project]] | [[Image:Author_change_chart.png|500px| Displays all edits authors have made throughout the life time of the project]] | ||
| + | |||
| + | = Author Dependency View = | ||
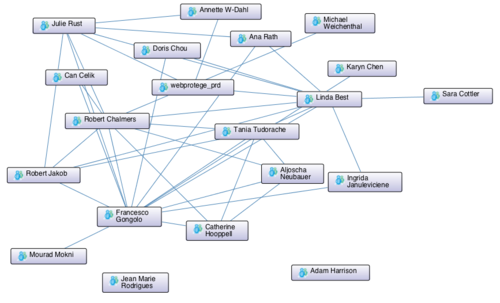
| + | [[Image:Author_network.png|500px| Displays dependencies between authors based on their changes]] | ||
| + | |||
| + | This graph-based visualization shows authors as nodes and two authors are connected if at some point they modified the same ontology entity. This represents a social dependency network between the various authors based on their change activities. A similar view exists for notes/annotations. | ||
</div> | </div> | ||
Latest revision as of 08:33, May 19, 2010
ChangeAnalysisTab
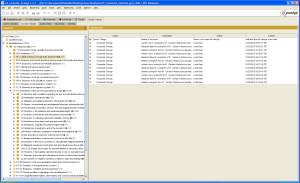
The plugin provides different views for exploring the annotation/change ontology associated with a project that uses the Change Management plugin. Changes and annotations can be explored based on authors, ontology terms, and visualized with respect to the life cycle of the project.
Contents
Versions & Compatibility
This section lists available versions of ChangeAnalysisTab.
If you click on the button below to add a new version of ChangeAnalysisTab, you will be asked to define a page title for the new version. Please adhere to the naming convention of ChangeAnalysisTab X.X.X when you define the new page!
Changelog
| Version | Changes in this version |
|---|---|
| ChangeAnalysisTab 0.1.2 | Minor bug fix. |
| ChangeAnalysisTab 0.1.1 | Updated the changes tree table to show the entity. |
| ChangeAnalysisTab 0.1.0 | Added a new view for displaying the author dependencies based on their changes and notes. |
| ChangeAnalsysisTab 0.0.9 | Loading bug - Fixed a bug with the progress window no longer displaying when the plugin is first loaded. ICD specific - Added some ICD specific options to generate statistics in HTML. |
| ChangeAnalysisTab 0.0.8 | Fixed a bug with the change counts not always adding up correctly in the concept change analysis tab. |
| ChangeAnalysisTab 0.0.7 | Tabs order changed - I moved the concept change view to be the first tab as I think this is the most useful view. Refresh - I added a "Change analysis" menu, which has a refresh option for refreshing the loaded changes. |
| ChangeAnalysisTab 0.0.6 | In all charts, you can now change how the data gets mapped to the time axis. You can choose to plot the data based on days, weeks, months and years. Each dimension of time gives you a different perspective on the change set. |
| ChangeAnalysisTab 0.0.5 | Added a filter for displaying only concept's that have been modified by a certain number of authors. |
| ChangeAnalysisTab 0.0.4 | Added a new filtering feature to the concept change analysis view. Changes can be filtered by authors and date ranges. |
| ChangeAnalysisTab 0.0.3 | Fixed a bug with the change propagation causing an infinite loop. |
| ChangeAnalysisTab 0.0.2 | Change/annotation tables - The change and annotation tables have been modified to use the same styling as the Changes Tab plugin.
Progress dialog - I added a Hide button to the progress dialog. Minor fixes - A few minor bug fixes for data loading. Data loading is now synchronous. |
| ChangeAnalysisTab 0.0.1 | First release of the plugin. |
Homepage
Find more information about the ChangeAnalysisTab on the official website.
Installation
The ChangeAnalysisTab is bundled with the "full" installation of Protege. For the latest release, you should download the plugin from here, and first remove your old Protege\plugins\edu.stanford.smi.protegex.changeanalysis directory. After, extract the downloaded zip file into your Protege\plugins director.
Please note, that if your edu.stanford.smi.protegex.changeanalysis directory contains both a changeanalysis.jar and a change-analysis.jar, you should remove the change-analysis.jar file.
Source Code
The source code for the Change Analysis Tab is available in the Protege Subversion repository: http://smi-protege.stanford.edu/svn/change-analysis/trunk/.
New and Noteworthy
Check out what's been included in the latest release of the ChangeAnalysisTab .
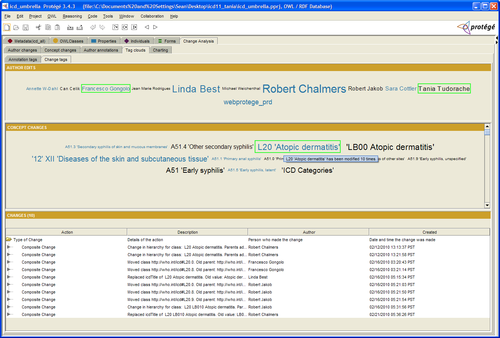
Tag Cloud View of Changes
Chart View of Author Changes
Author Dependency View
This graph-based visualization shows authors as nodes and two authors are connected if at some point they modified the same ontology entity. This represents a social dependency network between the various authors based on their change activities. A similar view exists for notes/annotations.


