Difference between revisions of "Graph Widget Tutorial OWL"
(incremental save of new content) |
(incremental save of new content) |
||
| Line 44: | Line 44: | ||
There are a couple of different scenarios in our example ontology that are good candidates for wanting to use the graph widget for knowledge acquisition. The first scenario is the idea that during the course of a clinical trial, a participant will make multiple visits to a clinical trial facility. This is something that could be represented by a simple sequence diagram, i.e., one visit, followed by another visit, followed by another visit, etc. In the following sections, we will perform the necessary steps in Protege-OWL to configure and use the graph widget. | There are a couple of different scenarios in our example ontology that are good candidates for wanting to use the graph widget for knowledge acquisition. The first scenario is the idea that during the course of a clinical trial, a participant will make multiple visits to a clinical trial facility. This is something that could be represented by a simple sequence diagram, i.e., one visit, followed by another visit, followed by another visit, etc. In the following sections, we will perform the necessary steps in Protege-OWL to configure and use the graph widget. | ||
| − | === | + | === Create the <code>has_planned_visits</code> property === |
<ol> | <ol> | ||
<li>Open Protege-OWL and load the example clinical trial ontology project (ClinicalTrialOntologyLite.pprj).</li> | <li>Open Protege-OWL and load the example clinical trial ontology project (ClinicalTrialOntologyLite.pprj).</li> | ||
| + | |||
<li style="padding-top: 5px;">On the OWLClasses tab, notice that we have a class entitled "ScheduleOfActivities", which is intended to model various activities that will take place during the trial. Another class to take note of is the "Clinical_Trial_Facility" class, which represents a medical facility that participants will visit.</li> | <li style="padding-top: 5px;">On the OWLClasses tab, notice that we have a class entitled "ScheduleOfActivities", which is intended to model various activities that will take place during the trial. Another class to take note of is the "Clinical_Trial_Facility" class, which represents a medical facility that participants will visit.</li> | ||
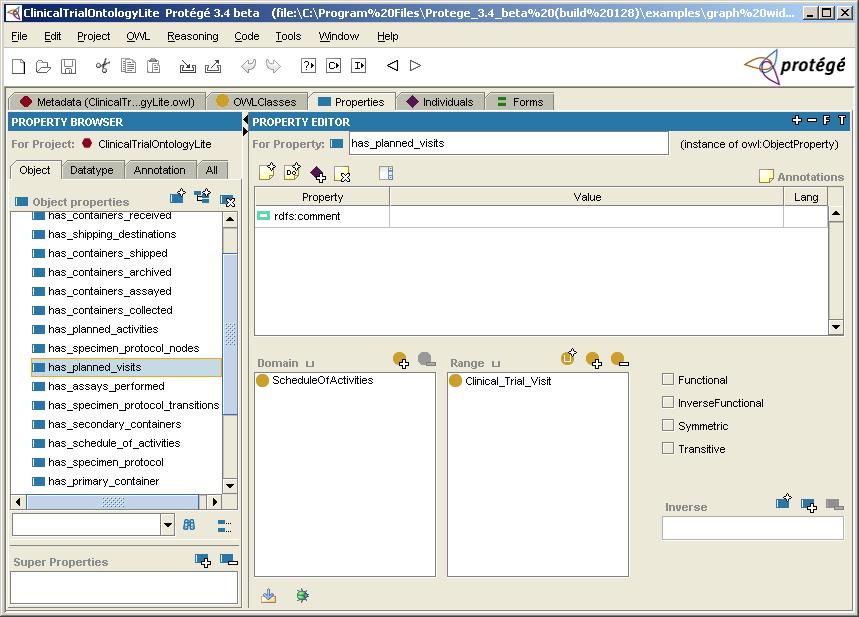
| − | <li style="padding-top: 5px;">Navigate to the Properties tab and create a new object property called "has_planned_visits" with ScheduleOfActivities as the domain and Clinical_Trial_Facility as the range. To follow is a screenshot of Protege-OWL after completing this step:</li> | + | |
| + | <li style="padding-top: 5px;">Navigate to the Properties tab and create a new object property called "has_planned_visits" with ScheduleOfActivities as the domain and Clinical_Trial_Facility as the range. To follow is a screenshot of Protege-OWL after completing this step: | ||
| + | <br /><br /> | ||
| + | [[Image:Graph-widget-tutorial_properties-tab.jpg]] | ||
| + | <br /><br /> | ||
| + | </li> | ||
| + | </ol> | ||
| + | |||
| + | === Configure the <code>has_planned_visits</code> property to use the graph widget === | ||
| + | |||
| + | <ol> | ||
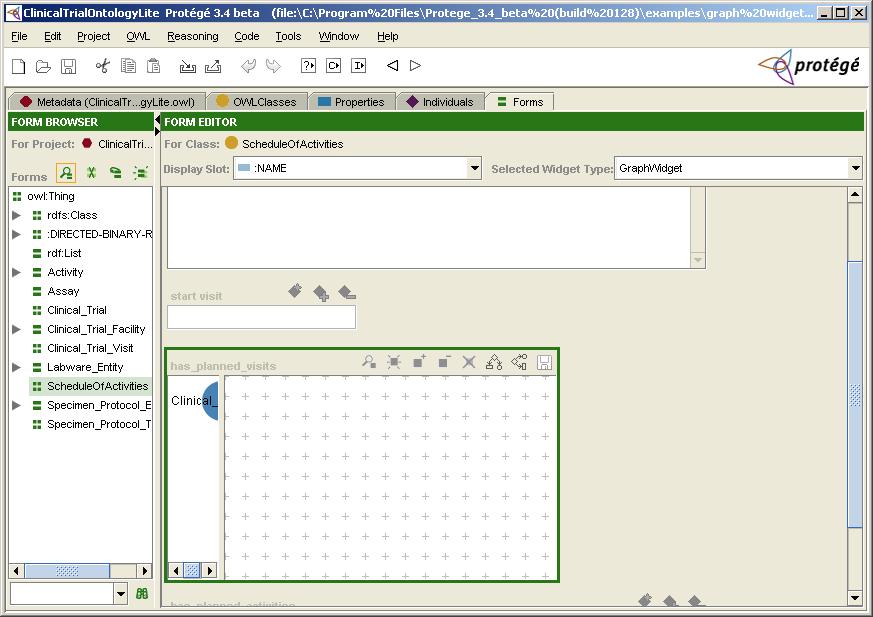
| + | <li>Navigate to the Forms tab and select the ScheduleOfActivities form in the Form Browser pane on the left.</li> | ||
| + | |||
| + | <li style="padding-top: 5px;">In the Form Editor pane on the right, select the has_planned_visits property. Protege-OWL will outline the property in green once it is selected.</li> | ||
| + | |||
| + | <li style="padding-top: 5px;">Select "GraphWidget" from the "Selected Widget Type" drop-down box in the upper right-hand side of the Form Editor pane. To follow is a screenshot of Protege-OWL after completing this step: | ||
| + | <br /><br /> | ||
| + | [[Image:Graph-widget-tutorial_forms-tab.jpg]] | ||
| + | <br /><br /> | ||
| + | </li> | ||
</ol> | </ol> | ||
Revision as of 18:43, March 19, 2008
Graph Widget Tutorial for OWL Ontologies
This tutorial assumes a basic working knowledge of Protege-OWL.
Contents
What is the graph widget?
The graph widget is a custom property widget that serves as an alternative to Protege Forms for creating and/or populating individuals in Protege-OWL. It is particularly useful in the following scenarios:
- visual editing of individuals and relationships between individuals
- visualizing networks of individuals
- visualizing relationships between individuals
- speeding up knowledge acquisition in ontologies with heavily interconnected concepts
- viewing data that resembles process diagrams, flow charts, organizational charts, etc.
A few words about Protege Forms
Before learning to use the graph widget, it is important to understand the concept of a Protege Form.
For each class in your ontology, Protege-OWL generates a default form that can be used to enter data for individual members of the class. Forms contain a data entry field, or "widget" for each property of an individual. There are different types of widgets to handle the various property types, e.g., Protege-OWL assigns a "MultiLiteralWidget" to datatype properties of type string, a "SingleLiteralWidget" for functional datatype properties of type string, etc.
If you do not like the property widgets that Protege-OWL assigns by default, you can customize individual forms on the Forms tab. Please note that the graph widget is only allowed for object properties that accept multiple values (non-functional).
Download example ontology
For the purposes of this tutorial, we will use a simplified version of a clinical trial ontology developed by Ravi Shankar at BMIR. For the most part, the concepts in this ontology are self-explanatory. To follow are some definitions of class names that may be less obvious at first glance:
- Aliquot – a measured portion of a sample taken for analysis
- Assay – a laboratory test to find and measure the amount of a specific substance
- Specimen_Protocol – protocol for handling a specimen in a clinical trial
In order to follow along with the tutorial in Protege-OWL, please download a copy of the example clinical trial ontology.
Get started using the graph widget
There are a couple of different scenarios in our example ontology that are good candidates for wanting to use the graph widget for knowledge acquisition. The first scenario is the idea that during the course of a clinical trial, a participant will make multiple visits to a clinical trial facility. This is something that could be represented by a simple sequence diagram, i.e., one visit, followed by another visit, followed by another visit, etc. In the following sections, we will perform the necessary steps in Protege-OWL to configure and use the graph widget.
Create the has_planned_visits property
- Open Protege-OWL and load the example clinical trial ontology project (ClinicalTrialOntologyLite.pprj).
- On the OWLClasses tab, notice that we have a class entitled "ScheduleOfActivities", which is intended to model various activities that will take place during the trial. Another class to take note of is the "Clinical_Trial_Facility" class, which represents a medical facility that participants will visit.
- Navigate to the Properties tab and create a new object property called "has_planned_visits" with ScheduleOfActivities as the domain and Clinical_Trial_Facility as the range. To follow is a screenshot of Protege-OWL after completing this step:

Configure the has_planned_visits property to use the graph widget
- Navigate to the Forms tab and select the ScheduleOfActivities form in the Form Browser pane on the left.
- In the Form Editor pane on the right, select the has_planned_visits property. Protege-OWL will outline the property in green once it is selected.
- Select "GraphWidget" from the "Selected Widget Type" drop-down box in the upper right-hand side of the Form Editor pane. To follow is a screenshot of Protege-OWL after completing this step: